320x100

* 퇴근후딴짓 님의 캐글 문제를 제가 풀어본 결과입니다. *
[유형1] 이상치 찾기
-> 문제 바로가기(캐글)
(문제) 데이터에서 IQR을 활용해 Fare컬럼의 이상치를 찾고, 이상치 데이터의 여성 수를 구하시오
(풀이)
# 라이브러리 및 데이터 불러오기
import pandas as pd
df = pd.read_csv("../input/titanic/train.csv")

# EDA
# print(df.head(3))
# print(df.shape)
# print(df.info())
# print(df.isnull().sum())

# IQR 구하기 (IQR = Q3-Q1)
# 최대 : Q3 + 1.5*IQR / 최소 : Q1-1.5*IQR

Q3 = df['Fare'].quantile(.75)
Q1 = df['Fare'].quantile(.25)
IQR = Q3-Q1

max_value = Q3 + 1.5*IQR
min_value = Q1 - 1.5*IQR

# 이상치 데이터 구하기
cond1 = df['Fare'] <= min_value
cond2 = df['Fare'] >= max_value
print(len(df[cond1]), len(df[cond2]))

# 이상치 데이터 여성
df1 = df[cond1|cond2]
cond3 = df1['Sex'] == 'female'
print(len(df1[cond3]))
320x100
[유형2] 분류, 3개 데이터set, Accuracy평가지표
-> 문제 바로가기(캐글)
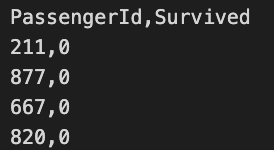
(문제) 학습용데이터(X_train, y_train)을 이용하여 생존예측모형을 만든 후, 이를 평가용 데이터(X_test)에 적용하여 얻은 예측값을 다음과 같은 형식의 csv파일로 생성하시오. (제출한 모델의 성능은 accuracy 평가지표에 따라 채점)
- 성능이 우수한 예측모형을 구축하기 위해서는 적절한 데이터 전처리, 피처엔지니어링, 분류알고리즘, 하이퍼파라미터 튜닝, 모형 앙상블 등이 수반되어야 한다.
- 수험번호.csv파일이 만들어지도록 코드를 제출한다.
- 제출한 모델의 성능은 accuracy로 평가함
(풀이)
# 라이브러리 및 데이터 불러오기
import pandas as pd

X_train = pd.read_csv('X_train.csv')
X_test = pd.read_csv('X_test.csv')
y_train = pd.read_csv('y_train.csv')

# EDA
print(X_train.shape, y_train.shape, X_test.shape)
print(X_train.info(), X_test.info(), y_train.info())
print(X_train.head(3), X_test.head(3), y_train.head(3))
print(X_train.isnull().sum(), X_test.isnull().sum()) # 결측치 확인
print(y_train['Survived'].value_counts()) # 생존비율 확인

# 데이터전처리 : 결측치 컬럼 제거, 학습에 불필요한 데이터 삭제(ID, 타겟컬럼 등)
# ID값 삭제, 옮기기
X_train = X_train.drop('PassengerId', axis=1)
Pass_id = X_test.pop('PassengerId')
print(X_train.shape, X_test.shape)
# 결측치 컬럼 삭제
X_train = X_train.dropna(axis=1)
X_test = X_test.dropna(axis=1)
print(X_train.shape, X_test.shape)


# 피처엔지니어링
# 수치형/범주형 데이터 분리
n_train = X_train.select_dtypes(exclude = 'object').copy()
n_test = X_test.select_dtypes(exclude = 'object').copy()
c_train = X_train.select_dtypes(include = 'object').copy()
c_test = X_test.select_dtypes(include = 'object').copy()

# 수치형 데이터 : min-max 스케일링
from sklearn.preprocessing import MinMaxScaler
cols = X_train.select_dtypes(exclude = 'object').columns
scaler = MinMaxScaler()
n_train[cols] = scaler.fit_transform(n_train[cols])
n_test[cols] = scaler.transform(n_test[cols])
print(n_train.head(3), n_test.head(3))

# 범주형 데이터 : 원핫인코딩 - 컬럼가 적을 때 사용, train/test 데이터 합쳐서 인코딩하고 다시 분리하기
cols = X_train.select_dtypes(include = 'object').columns
all_df = pd.concat([c_train, c_test])
all_df = pd.get_dummies(all_df[cols])
print(all_df.shape)

# train/test 데이터 다시 분리하기
line = int(c_train.shape[0])
# print(line)
c_train = all_df.iloc[:line, :]
c_test = all_df.iloc[line:,:]
# print(c_train.shape, c_test.shape)

# 수치형/범주형 데이터 다시 합쳐서 X_train, X_test 데이터 만들기
X_train = pd.concat([n_train, c_train], axis=1)
X_test = pd.concat([n_test, c_test], axis=1)
print(X_train.shape, X_test.shape)


## 훈련/검증 데이터 나누기
from sklearn.model_selection import train_test_split
X_tr, X_val, y_tr, y_val = train_test_split(X_train,
                                           y_train['Survived'],
                                           test_size = 0.1,
                                           random_state = 2022)
X_tr.shape, X_val.shape, y_tr.shape, y_val.shape


## 모델 선택/훈련/평가/최적화 (분류 : RandomForest, Decison Tree, XGBoost, 로지스틱회귀)
# 랜덤포레스트
from sklearn.ensemble import RandomForestClassifier
model = RandomForestClassifier(n_estimators=500, max_depth=9, random_state=2022)
model.fit(X_tr, y_tr)
pred = model.predict(X_val)

# accuracy 평가
from sklearn.metrics import accuracy_score
print(accuracy_score(y_val, pred))

#하이퍼파라미터 튜닝
# n_estimators=100, max_depth=3, random_state=2022 0.5694444444444444
# n_estimators=200, max_depth=5, random_state=2022 0.5694444444444444
# n_estimators=400, max_depth=7, random_state=2022 0.7638888888888888
# n_estimators=500, max_depth=9, random_state=2022 0.8055555555555556
# n_estimators=700, max_depth=11, random_state=2022 0.7916666666666666

## X_test로 결과 예측 및 최종 파일 제출
pred = model.predict(X_test)
pred

submit = pd.DataFrame({
    'Pass_id' : Pass_id,
    'Survived' : pred
})

# print(submit.head(3))

submit.to_csv('0000.csv', index = False)

# print(pd.read_csv('0000,csv'))
반응형
[유형3] 쌍체T표본검정 (예시문제)
(문제) 주어진 데이터는 고혈압 환자 치료 전/후의 혈압이다. 해당 치료가 효과가 있는지 대응쌍체표본t-검정을 진행하시오.
- 귀무가설(H0): >= 0
- 대립가설(H1): < 0
- = (치료 후 혈압 - 치료 전 혈압)의 평균
- 유의수준: 0.05
- 의 표본평균은?(소수 둘째자리까지 반올림)
- 검정통계량 값은?(소수 넷째자리까지 반올림)
- p-값은?(소수 넷째자리까지 반올림)
- 가설검정의 결과는? (유의수준 5%)
(풀이)
import pandas as pd
df = pd.read_csv("ㅇㅇㅇㅇ.csv")

# print(df.shape)
# print(df.info())
# print(df.head(3))

# (120, 5)

#  #   Column   Non-Null Count  Dtype
# ---  ------   --------------  -----
#  0   Id       120 non-null    object
#  1   sex      120 non-null    object
#  2   age      120 non-null    int64
#  3   bp_pre   120 non-null    int64
#  4   bp_post  120 non-null    int64

#      Id   sex  age  bp_pre  bp_post
# 0  p001  Male   33     149      129
# 1  p002  Male   39     168      168
# 2  p003  Male   70     176      155


df['u'] = (df['bp_post'] - df['bp_pre']).mean()
# print(df['u'])

# 1. u의 표본평균, 소수둘째자리까지 반올림
print(round(df['u'].mean(),2))

# 2. 검정통계량 값은?(소수 넷째자리까지 반올림)
from scipy import stats
st, pv = stats.ttest_rel(df['bp_post'], df['bp_pre'], alternative = 'less' ) # 앞에 값이 뒤에값보다 커야 하는 경우 greater, 작아야 하는 경우 less, 같지 않은 경우가 기본값
print(round(st,4))

# 3. p-값은?(소수 넷째자리까지 반올림)
print(round(pv,4))

# 4. 가설검정의 결과는? (유의수준 5%)
# p값이 0.05보다 작으므로 귀무가설 기각, 대립가설 채택
320x100
반응형
'자격증공부 > 빅데이터분석기사' 카테고리의 다른 글
| [빅데이터분석기사] 모의고사3 (결측치, 분류, map, 단일T검정) (0) | 2023.06.30 |
|---|---|
| [빅데이터분석기사] 모의고사2 (이상치, 소수점데이터 찾기, 소수점데이터처리, 분류(3개set), 독립표본t-test) (0) | 2023.06.30 |
| [빅데이터분석기사] 모의고사 5 (누적합, 결측치, 이상치, 정렬, 회귀, 정규분포검증) (0) | 2023.06.30 |
| [빅데이터분석기사] 모의고사4 (표준편차, 그룹합, 값 대체, 회귀, 일원배치법) (0) | 2023.06.30 |
| [빅데이터분석기사][작업형2] 5회 기출문제 풀이(회귀) (0) | 2023.06.22 |


